
Backpass: What advanced stats tell us about what went wrong with the 2022 Rapids
Some players were asked to step up, and did. Others were asked to step in, and didn't. According to the numbers, what went right, and what didn't, in 2022?


All things being equal, most of the players and tactics from the 2021 to the 2022 Colorado Rapids … were equal. There was not a massive DP signing, although the addition of Gyasi Zardes was significant. We lost Cole Bassett and Kellyn Acosta and Auston Trusty, but gained Bryan Acosta and Lucas Esteves. Mostly, though, the roster was the same. The coach was the same. The results, however, were not the same.
The Rapids have been significantly worse in 2022 than they were in 2021, when they compiled 61 points en route to winning the Western Conference. This season, the team has just 36 points through 30 games, which puts them on pace for 40.8 points at seasons end; a massive decline.
We must try and understand what happened, and advanced stats like Expected Goals (xG), Expected Assists (xA) and Goals Added (G+) can be helpful both on an individual player basis and on a team-wide scale at determining what has improved and what has declined from year to year. So I thought I’d take a stab1 at trying to explain, as best as I can, what happened.
I broke out the Rapids based on the top 11 outfield players, plus two bench players, based on minutes played; taking a look at their xG, xA, and G+ data in both 2021 and 2022.2 Generally, players are compare position by position. When it made sense, I compared a player’s production from one year to the next, although when the player that took up the most minutes at the same position was different, I compared those two players numbers one to another. This explains why I did not make and one-for-one comparison between ‘21 Jonathan Lewis and ‘22 Jonathan Lewis. Lewis was more of a super sub in 2021 and a starter in 2022.
Note also that, based on minutes played, the key formations used in 2021 and 2022 are different. The most minutes went to players playing a 5-3-2 in 2021, and a 3-4-3 in 2022; that may affect some of how the numbers tell the story.
I was looking to see 1) which positions got better or worse, 2) which specific players may have gotten better or worse, and 3) how big a rise or drop things may have taken.
Below is the chart. You may want to zoom your screen for easier viewing. Red and yellow equals high scores or significant increase, green and blue mean low scores or significant decrease. And all numbers were normalized on a 96 minute basis. So, what do we learn?
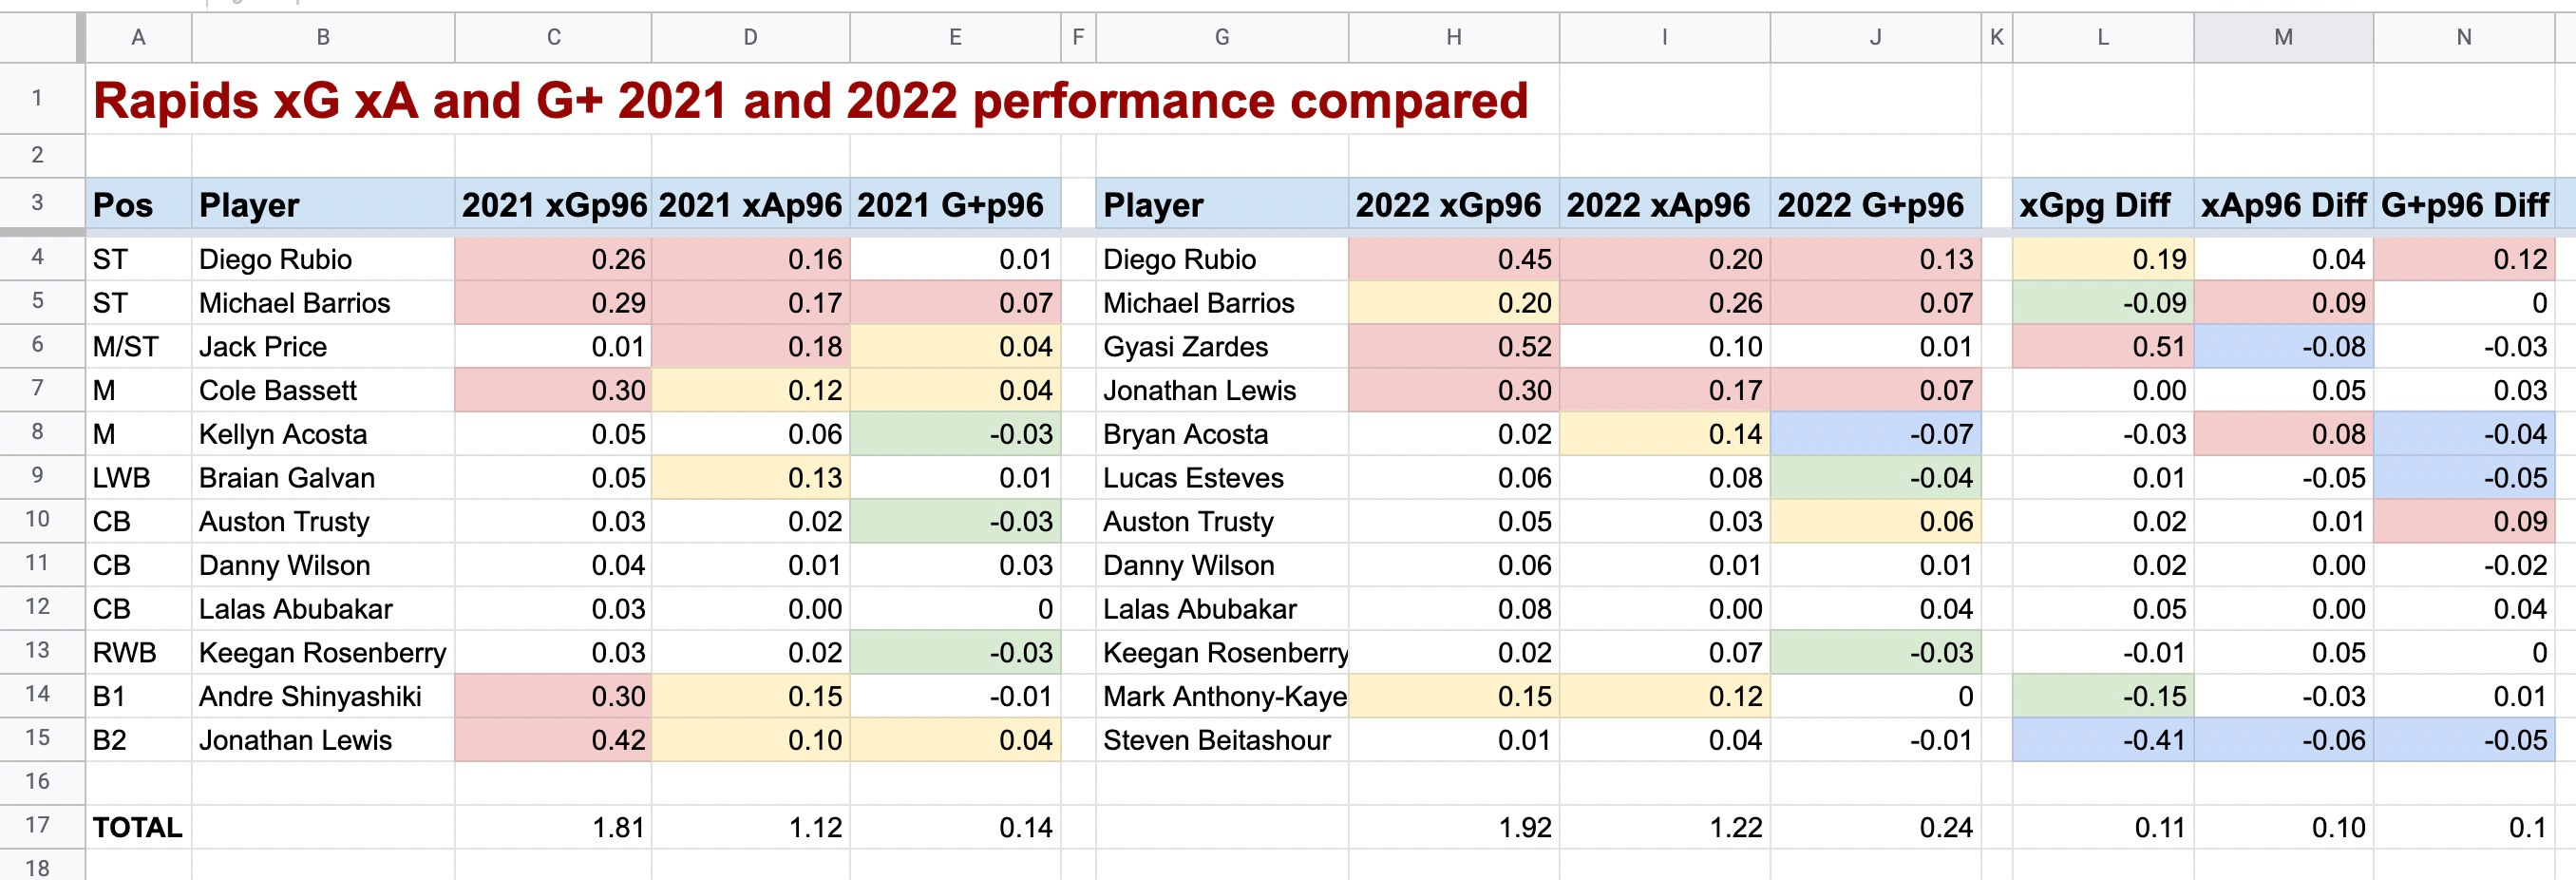
1) Diego Rubio is having a better year than last
You don’t need advanced metrics to know that Diego Rubio is having a very good 2022. With 13 goals and 5 assists to date, the attacker is without a doubt the team’s MVP. He leads the team in G+ per 96 with +0.13, an improvement of a whopping 0.12 over 2021. He’s been healthy, he’s been starting, and his finishing is better than it has been since 2018. He’s also outperforming his Expected Goals: math has him at a 10.6 xG and he has 13 goals. Team-wide, if everyone over-performs expectation, the team would win more than data models would suggest. Alas, that has not been the overall pattern.
One might ask questions, though, about what it means when one player makes great strides. It could mean the team has become more reliant on one player, or more one dimensional in attack. I don’t think that’s the case. Simply put, Rubio’s been seeing more of the ball in goal-dangerous situations, and has converted as-or-better-than expected. However, among MLS strikers with 500 or more minutes, Rubio is only 23rd in Goals and 27th in Expected Goals. So while Rubio’s been very good, he’s not getting enough deadly chances to change the fate of this team, who sit 20th in the Overall MLS standings.
2) On paper, the team is better than last year, and better than results indicate
This statement above is the kind of thing that, if it would help Pádraig Smith and Fran Taylor with the fan base, they should scream it from the rooftops. Alas, telling your supporters ‘Math says this team is better than it has performed!’ is rarely a winning argument. Most fans prefer to look at the league table.
If you look at the totals for xG, xA, and G+ at the bottom of the columns for 2021 and 2022, the 2022 numbers are better. The Rapids have produced +0.11 more Expected Goals, +0.10 more Expected Assists, and +0.10 Goals Added from 2021 to 2022. Remember that xG and xA are purely offensive numbers while G+ measures a players total team contribution on the pitch, both offensive and defensive. Math says the Rapids passes, tackles, clearances, dribbles, shots, and turnovers should have them roughly as good or better than last year.
I have two possible explanations for why that hasn’t been the case. The first is that we measured the average contribution of the 13 players with the most minutes. Perhaps it’s that next category of players, the deep bench, where the real decline lies. In reality, that’s probably not it, because this next chart - which is also the basis for explanation 2 - effectively refutes it.
Here’s that chart; of team xG, xA, and G+ compared between 2021 and 2022, along with the Expected Points that that produces.
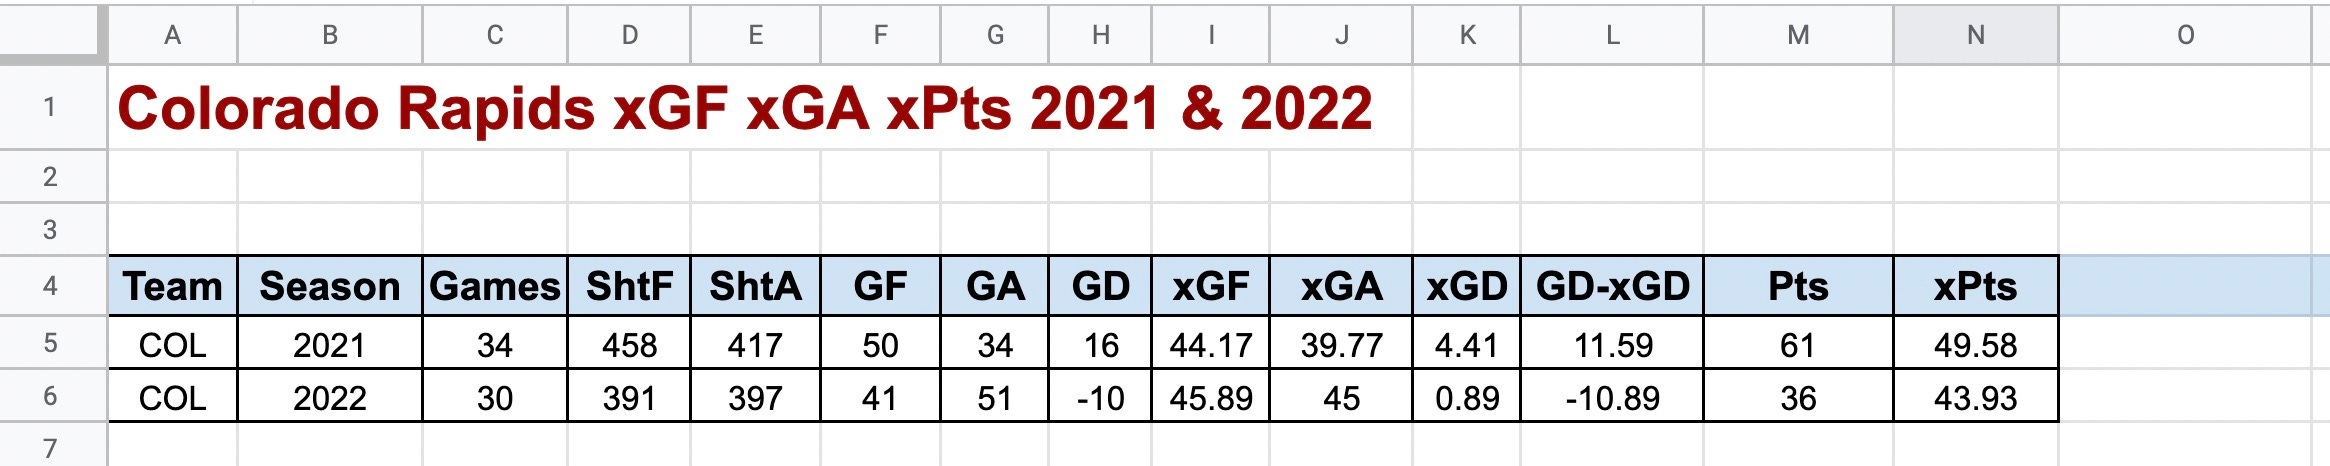
I said it at times on the HTHL podcast last year, and in some Backpass articles - the 2021 Rapids overperformed in 2021. You can see in the chart that the team had an xG of 44.17 but scored 50 goals, outperforming expectation by 5.83 goals. They over-performed their xGA, and their xGD, and thus out-performed their Expected Points too. The Rapids xPts of 49.58 should have been good enough for 5th in the Western Conference, not first.
Similarly, the Rapids are underperforming expectation this year; the modeling thinks Colorado ought to have a positive Goal Differential of +0.89, but they’re actually on a negative GD of -10. Their xPts is 43.93, but they’ve scrounged up only 36 real points.
And now I’m going to say the most devastating sentence of the year.
According to ASA, the Rapids 43.96 xPts should have them as the third best team in the West - behind only LAFC and Nashville.
Colorado’s finishing isn’t as good as it ought to be, and they’ve been unlucky offensively, since they’ve underperformed xGF by -4.89. And their final shot defending isn’t as good as it ought to be, and thus they've been unlucky3 defensively too.
This might be tough to swallow - like I’m making excuses for this team. I’m not trying to. I simply looked at the numbers and noticed that, simply put, they should be better than they are.
3) Michael Barrios and Jonathan Lewis are big xG and G+ producers. However…
Both Michael Barrios and Jonathan Lewis had good years in 2021. But while Barrios started most games and led the team in G+ with 0.07 per 96, Lewis had just 12 starts and 1304 minutes, producing a more modest 0.04 G+p96. This year, Lewis has been the go-to winger for the club, with 23 starts and 2041 minutes, and he’s one of the teams top three players in terms of G+, alongside Barrios and Rubio.
However. Lewis and Barrios are great at getting into important spots - less great at making something happen - a shot or an assist - in that spot. Lewis’ xG of 7.7 is better than the 5 goals he’s actually produced. Barrios is closer to expectation, but still a little below the line - he has an xG 3.4 and an xA of 4.6 against 2 goals, 5 assists.
The Lewis numbers pass the eye test. Dude has pace for days and creates tremendous chances by burning guys on the dribble into the box. But his finishing and his final passing are below average this year (he was right on the money in 2021 - with 7.3 xG, 7 goals for the year).
These two are still most definitely the best options on the roster at the wings. The only other wingers/wingbacks on the team are unproven youngsters Sebastian Anderson and Darren Yapi, the underwhelming Lucas Esteves (who we’ll talk more about in a sec) and Sam Nicholson. Sam’s been used in a relief role since returning to the club, but the numbers indicate he’s been pretty bad - with a -0.10 G+4 in 600 minutes played, and negative numbers in every G+ category.5
4) Gyasi Zardes hasn’t been a difference maker
If you’ve watched the Rapids, I doubt you needed advanced statistics to figure this one out. Zardes has 9 goals with 10.4 xG, which is ok, but the team needed him to outperform his xG like Rubio in order to set them right.
The big problem isn’t in the goal scoring or finishing - it’s the other things. Zardes’ G+ - his overall contribution in passing and defending, and all the other things, is a nearly-flat +0.01. He’s not bad; all his numbers are either 0.01 or -0.01, except for a +0.04 Receiving G+. Simply put, he’s just league-average as a striker. And a league-average striker in a league with 28 teams will put you around 14th overall, if that production was copy-pasted to other positions. Alas, as we know from this season’s results, this team is not in 14th overall, nor are the players at the other positions the 14th best alternatives in MLS.
5) Bryan Acosta and Lucas Esteves haven’t been enough
Among all the players on this team, the only two who have been significant downgrades over the guy that previously occupied their positions are Bryan Acosta and Lucas Esteves.
Acosta’s -0.07 G+p96 is somewhat lower than Kellyn Acosta’s -0.03 mark. According to the ASA website, his real achilles heel is in receiving, where he’s a -0.03.
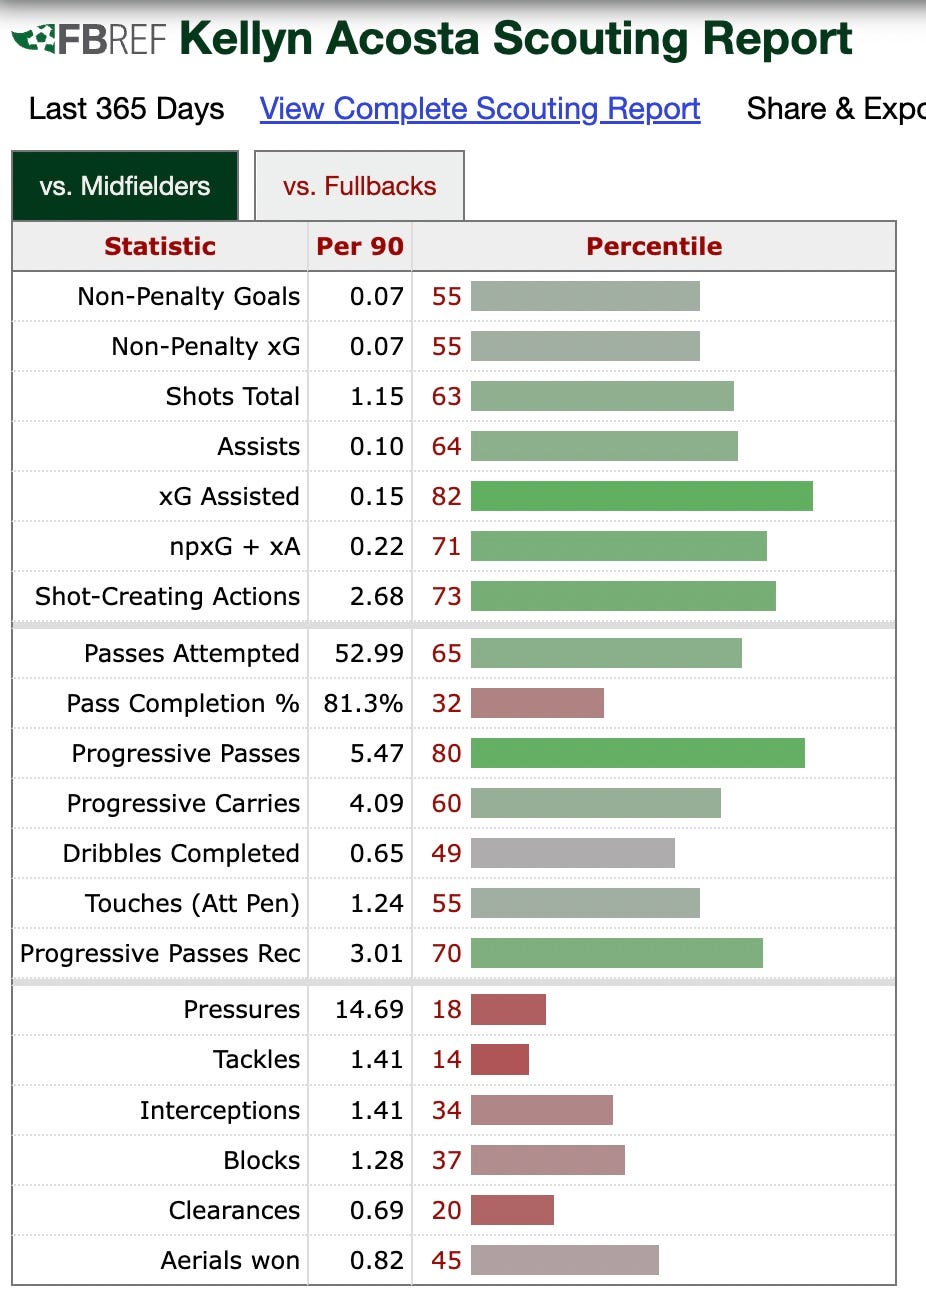
It is a little complicated to figure out what Bryan Acosta is doing wrong, because it’s hard to tell exactly what the team needs him to be. Look at his percentile stats from fbref.com.
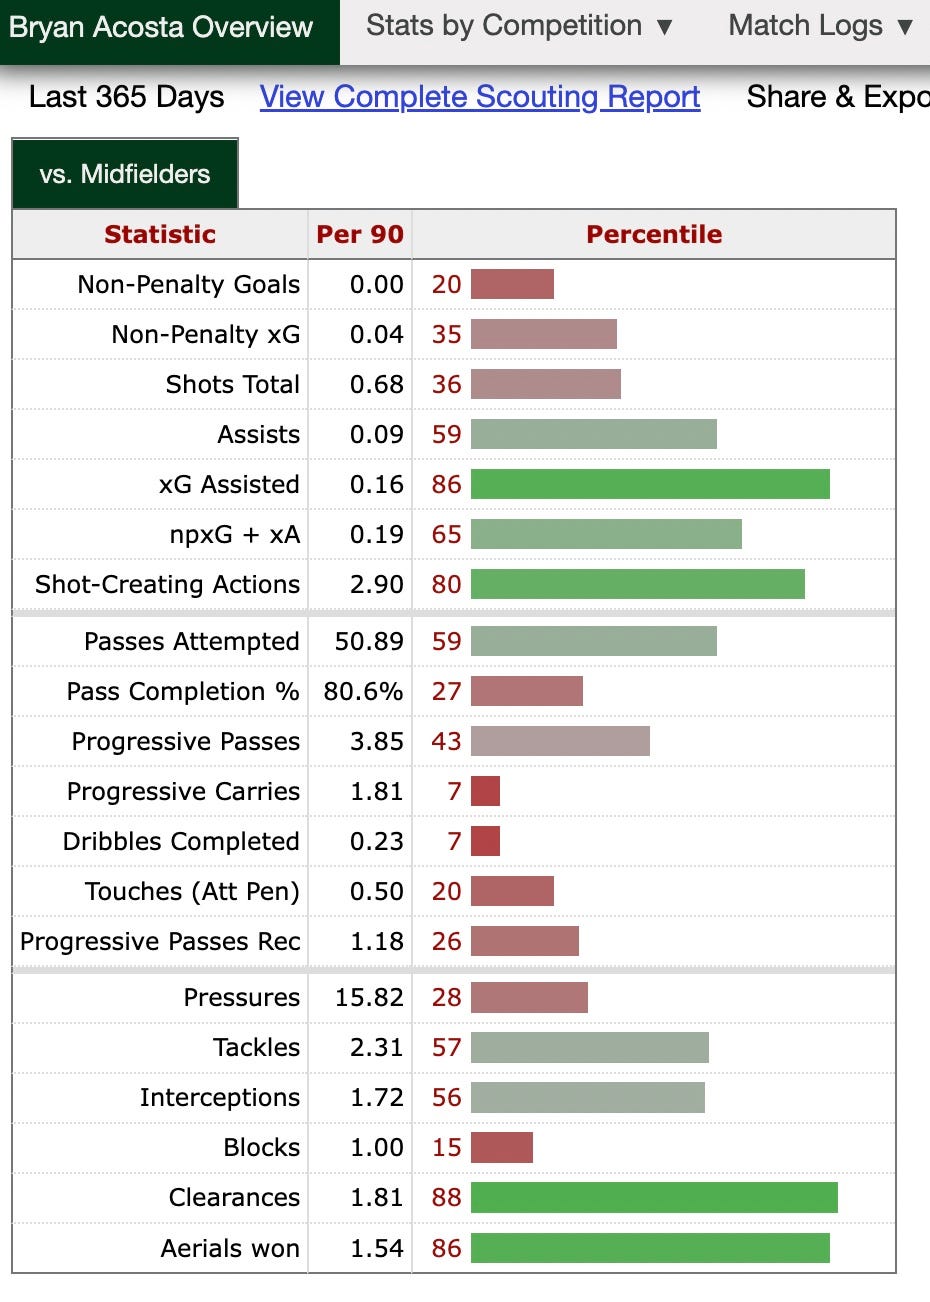
Clearly he passes the ball adequately, as evidenced by his xG assisted and npxG + xA numbers. But he’s a turnover machine in possession - 7th percentile in Dribbles Completed and Progressive Carries. And his defense - 57th pct. in Tackles, 56th in Interceptions - is fine, but nothing to get excited over.
Considering Jack Price has been out a lot this year, we might assume he’s supposed to fill in for Jack. But looking at his 2021 numbers, we see it’s … not the same.
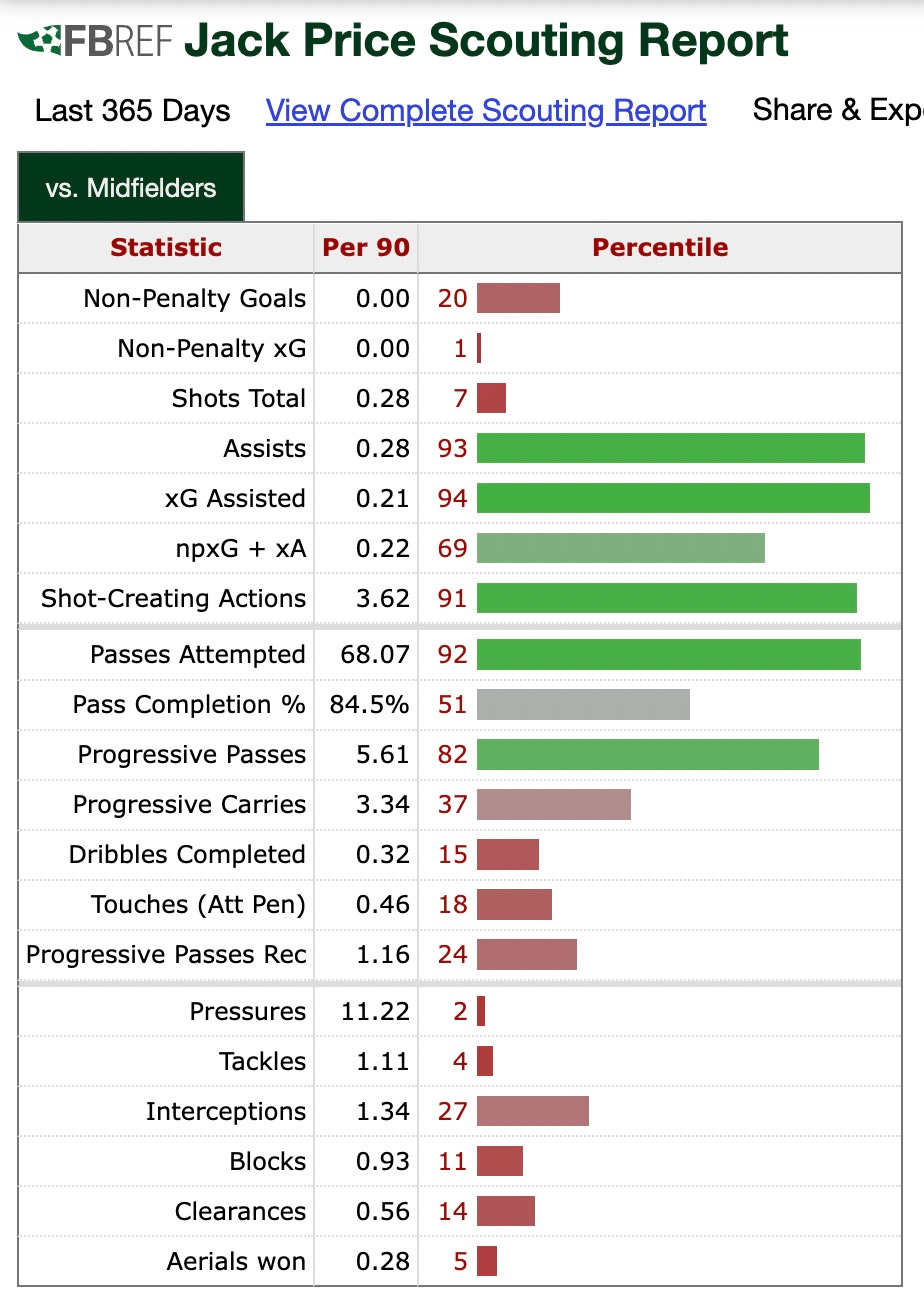
Acosta’s been ok at duplicating some of Price’s passing ability, but he’s not Jack, who was truly elite in 2021 at unlocking defenses with the precision throughball, diagonal, or over-the-top bomb, as well as on set pieces. But Jack didn’t give you all the defense you needed, so he needed to be backed up by Kellyn Acosta. So perhaps Bryan Acosta truly was supposed to be a like-for-like Acosta-for-Acosta replacement.
Kellyn was a real attacking threat - both a midfield goal scorer and a shuttler-facilitator in moving the ball through the midfield. His defense, while not exceptional, was adequate, and more than compensated for by what he added in offense. And as USMNT fans have witnessed, if you asked Kellyn Acosta to sit deeper and run around like a maniac and harass, he could do it.
Bryan Acosta is good at some things clearly - he’s better in the air than both Kellyn and Jack. He’s good in a dead ball situation, and in passing. He’s a better defender than both Kellyn or Jack, but apparently not good enough to replace the offense the team loses when he’s on the pitch. He was simply not as good as either Price, a near all-star caliber regista, or K. Acosta, a US national team stalwart. And for the Rapids to be league average, that’s effectively what they needed him to be.
Lucas Esteves’ -0.05 G+ is the worst on the team for a starter. Break that number down, and it’s his -0.04 Passing G+ that’s killer. He’s a below average passer from Left Wing, a position previously occupied by Braian Galvan, a fair passer who was also a scoring threat, and Sam Vines, an above-average passer who also was a fantastic defender. That’s a downgrade at left back, a sneaky important spot in modern football that I might argue is one of the top four most important positions on the pitch. Esteves is probably above his level at MLS. Or, as a young 22 year old, he could be an MLS caliber fullback, if given a few years to adjust. As it happens, he was the only option in 2022 at left back, and so he was thrown in the deep end. He tread water, but he hasn’t yet proved he can swim with Western Conference sharks.
…
One additional issue that might contribute to the fall off from 2021 to 2022 is set pieces. That isn’t reflected in the numbers I’ve shown so far.
Jack Price was one of the league leaders in assists in 2021, mostly from set pieces. He only got his first assist of the year on Saturday. Colorado relied on set pieces in 2020 and 2021 to power their offense, but in 2022, without the maestro to conduct the orchestra, the music didn’t sound the same. According to fbref, Colorado have produced just 3 goals from dead ball situations in 2022. In 2021, they produced 8 goals from dead ball situations; tied for second amongst all MLS teams. Think how many more points this team would have with just five more goals in the right games.
Clearly from the numbers gathered, there’s a world in which a few balls rattle in off the post that otherwise wouldn’t have; a few PK shouts that go our way; a few opposing shots don’t go in, and the team has a radically different trajectory. The numbers indicate this team wasn’t terrible. But small things added up throughout the season and kept Colorado from repeating as an elite force in MLS this season.
Once upon a time, I would avoid this kind of language because the memory of Marco Pappa was still fresh in our minds. I think the statute of limitations on fans memories of Mr. Pappa’s unfortunate incident with a former Miss Washington and a pointy pointy knife has thankfully expired.
All stats taken from American Soccer Analysis.
Basically, too many Brandon Servania-type goals conceded, not enough Shkelzen Gashi-type goals scored.
22nd out of 26 Rapids players, and worst among players with more than 300 minutes.
Dribbling, Fouling, Interrupting, Passing, Receiving, and Shooting. Sample size is still a little small, but there’s no indication that Sammy’s best used as anything other than a guy you throw on in the 80th minute when the result is already certain.